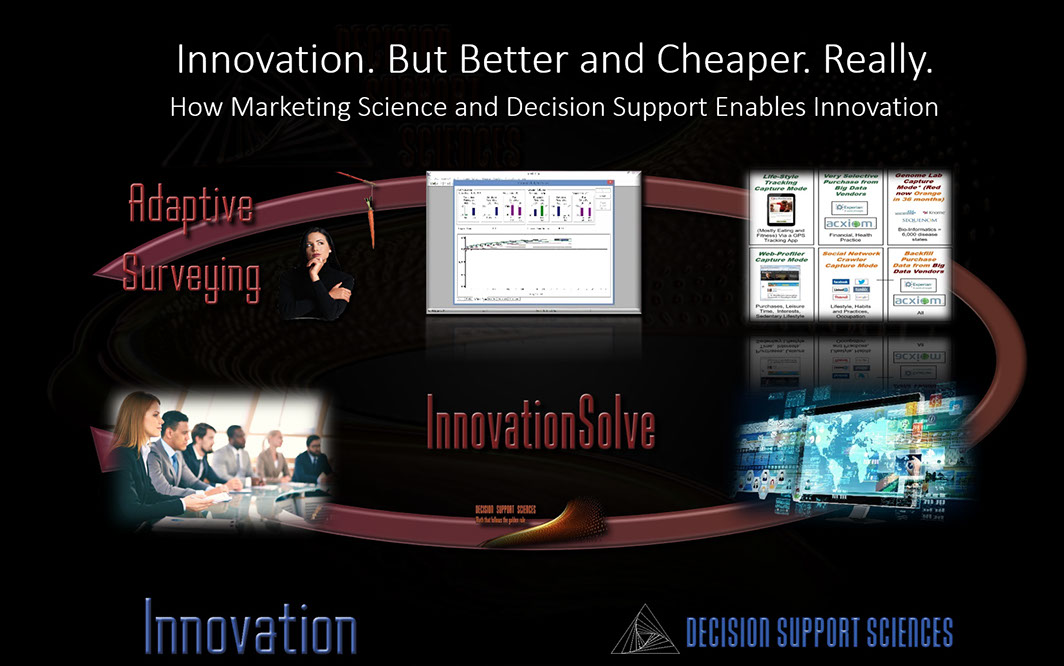
Innovation
GETTING THERE BEFORE ANYONE ELSE. REALLY. (2 minute video)
(Be sure to run the video in fullscreen by clicking on the icon below.)
FINDING LATENT OPPORTUNITY. FIRST.
IT'S TIME. (INTRO VIDEO.)
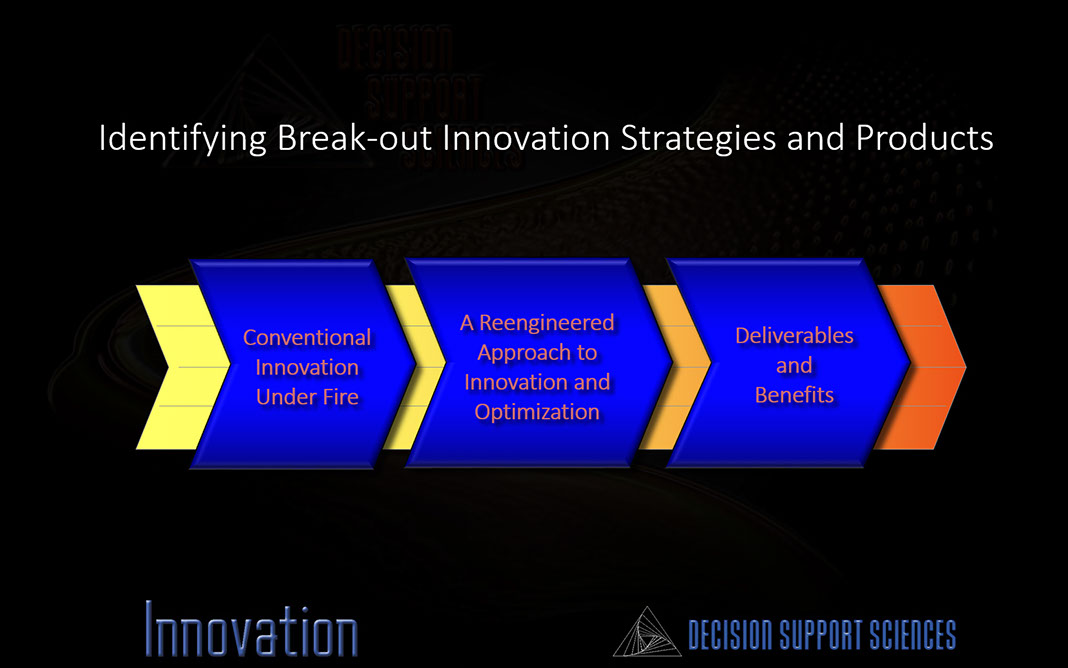
THE LIMITATIONS OF CONVENTIONAL APPROACHES
REINVENTING INNOVATION USING DECISION SUPPORT ENABLEMENT (DSE)
THE PHASES and STEPS
OF A DSE INNOVATION ENGAGEMENT
KEY BENEFITS
EXAMPLE CLIENTS
CONTACT / QUESTIONS
VIDEO
CENTER
CONSULTING
PLATFORMS
SOFTWARE
SOLUTIONS BY INDUSTRY
THE LIMITATIONS OF CONVENTIONAL INNOVATION APPROACHES
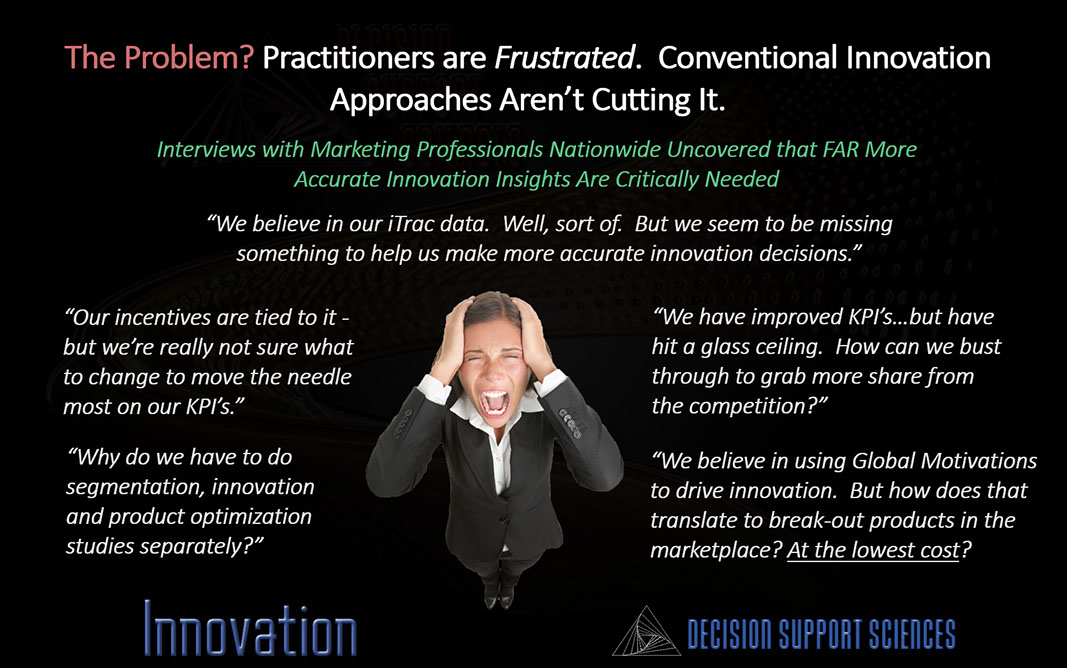
Conventional approaches (even "best practice" approaches) to innovation fail for four primary reasons:
-
The results are
built upon a sub-optimal -- or simply misdirected -- notional model of innovation
.
It:
- Doesn't place demand on the same brandscape as the needs of consumers and the current product offerings. Demand is the missing link in innovation.
- Doesn't take into account inertia caused by brand loyalty or habituation.
- Doesn't overlay need segments onto the brandscape...so it has no clear idea how to meet needs.
-
The
data
collected
is incomplete or inadequate
. The measurement system:
- Misses important drivers of innovation.
- Doesn't determine repositioning thresholds - how much improvement or differentiation is needed to get a prospect or customer to a more attractive position.
- Fails to recognize that, psychometrically, the average customer highly values only 3-4 key drivers yielding only 25 or so key drivers across all segments - not hundreds of drivers.
- Doesn't eliminate or factor analyze drivers of innovation to assure their independence.
-
The
decision support
system for innovation
is absent or inadequate
. It:
- Doesn't quantify how far you can move your product - realistically.
- Doesn't identify the brands that have weak vs. strong brand images.
- Doesn't explore your competitive space (brandscape) for threats.
- Doesn't automatically test millions of innovation strategies and find the optimum strategy that moves your product or service into unoccupied volumes of high demand...at the lowest cost.
-
The
consulting firm
:
- Imagines that they are your equity partner - and they charge you that way.
- Gives you the fish (the answer)...but not the fishing pole (the decision support system).
REINVENTING INNOVATION USING DECISION SUPPORT ENABLEMENT (DSE)
What if you could leap-frog the limitations just listed above and:
- Identify where innovation/demand opportunity exists on the brandscape?
- Visualize your competitive space more accurately than ever before?
- Clarify the positioning of BOTH your competitors AND the market's key features?
- Explore your competitive space (brandscape) for threats?
- Quantify how far you can move your product (your competitive volume?)
- Identify and visualize segments of existing and unmet demand on the brandscape?
- Perform simulations - move into areas of unoccupied demand?
- Identify how to best penetrate into areas occupied by weaker competitors?
- Move your product/brand away from stronger or no net gain competitors?
-
Test millions of potential change strategies and find the strategy that:
- Maximizes market share capture by moving into areas of maximal demand that are the least occupied by the competition?
- Minimizes cost to arrive at the that most advantageous position?
- Maximizes market share opportunity at the lowest cost?
Decision Support-Enabled Innovation achieves all these outcomes and more. The result? Far more accurate and cost effective innovation strategies...at a far lower cost. Delivered you way. That's enablement.
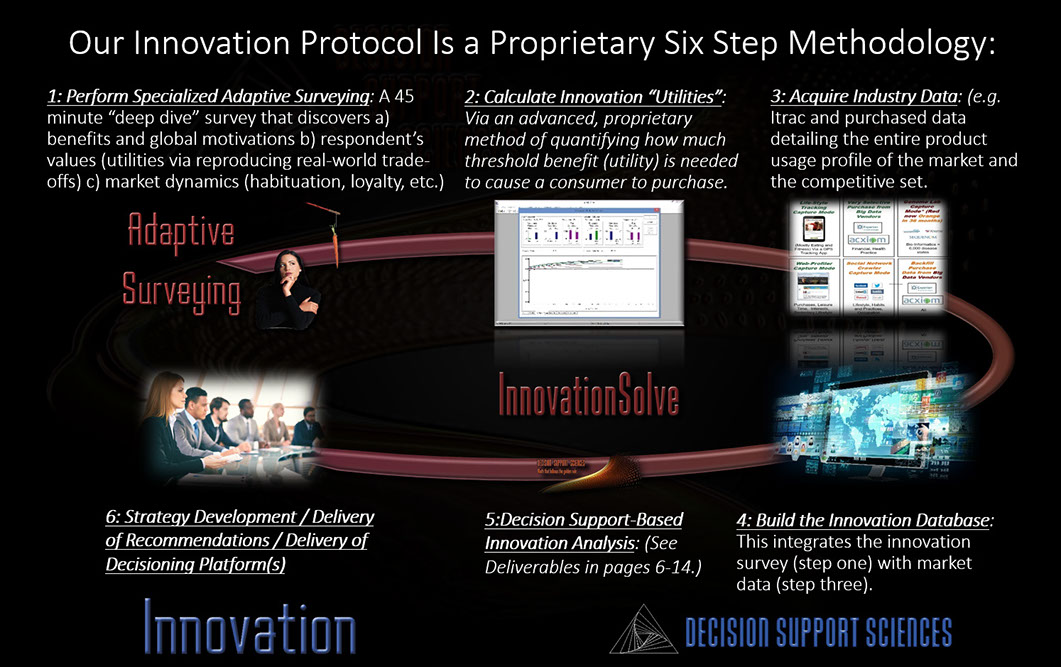
PHASES AND STEPS OF A DSE INNOVATION ENGAGEMENT
(Click on the first icon below to start the slide show.)


<
>
1 - 14
x
Close and Return
KEY BENEFITS (Place your pointer over the benefits to see the short description.)

Our innovation practice leverages InnovationSolve™ our innovation discovery platform. Not only is InnovationSolve™ visual (it compresses relevant information into a 3-D strategy map) it is dynamic. That is, it lets the strategist "what-if" with the characteristics of any product to see how those changes vary the positioning (location), preference and demand share of that product.

One of InnovationSolve™'s primary strengths, a characteristic it shares with PositionSolve,™ is optimization. Above is an actual real time screen capture from InnovationSolve™'s run optimizer. Notice first that InnovationSolve™ is fast. 250-500 Discriminant Analysis models can be run in about 10 seconds on a modern laptop. But more importantly, notice that the correct classification percentage (a measure of the "goodness" of the resulting brand landscape) increased from 50% to over 75%. These optimizations include transforming the predictors, eliminating those that do not meet user-adjustable criteria, and by using dozens of algorithms and sub-algorithms. Optimization is InnovationSolve™'s middle name!
InnovationSolve™'s dynamic capabilities include automated and directed product movement on the strategy map. In directed movement the strategist "drags" a product to a new position using competitive repositioning (CR). In CR the system mathematically solves for all the possible ways to arrive at that new location. In automated movement the system runs millions of changes to a given product to discover its competitive niche (CN).

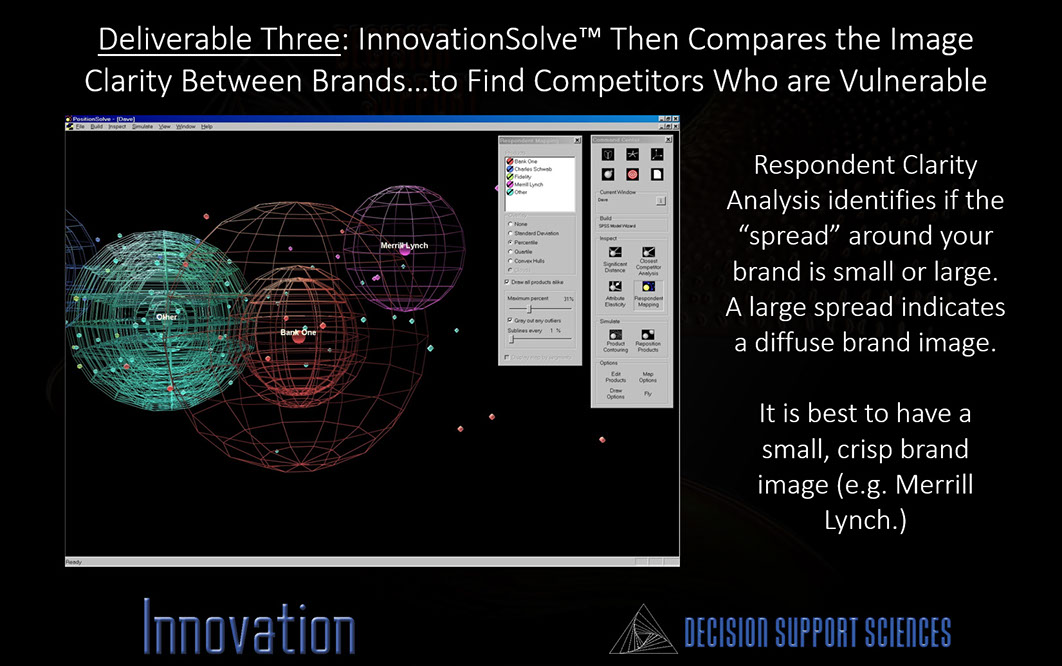
InnovationSolve™ has all the capabilities of PositionSolve,™. It is, in fact, a superset of PositionSolve.™ As such, it allows the strategist to understand which competitors are truly closest to one another, how far products can move on the brand landscape, how diffuse a product's brand image is, how to penetrate competitive niches, how to visualize market segments, and how to perform competitive repositioning.

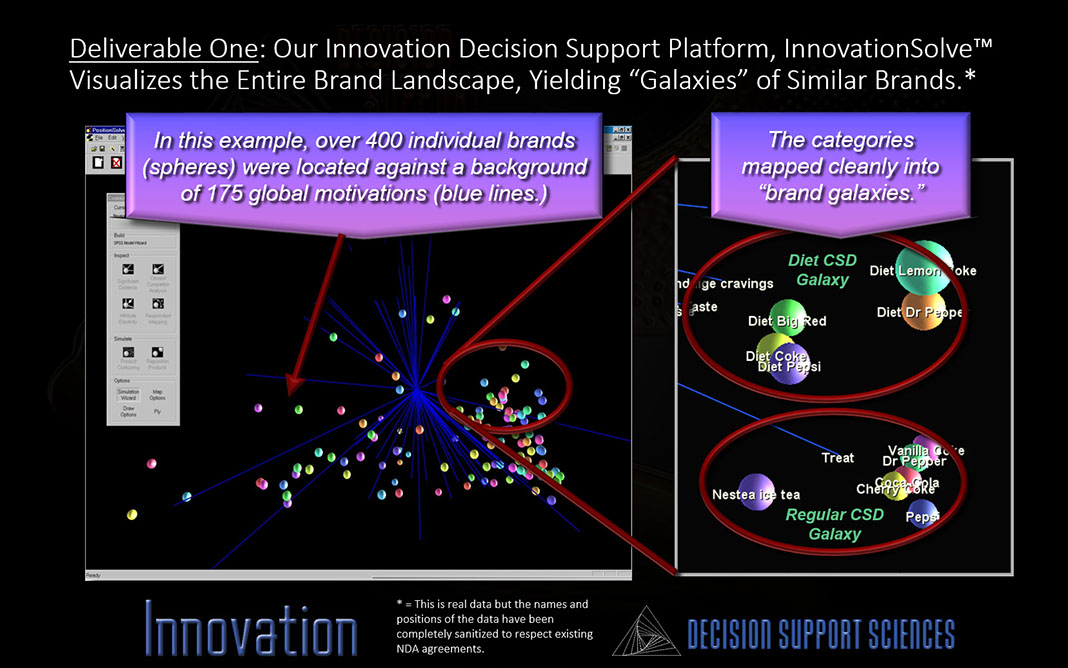
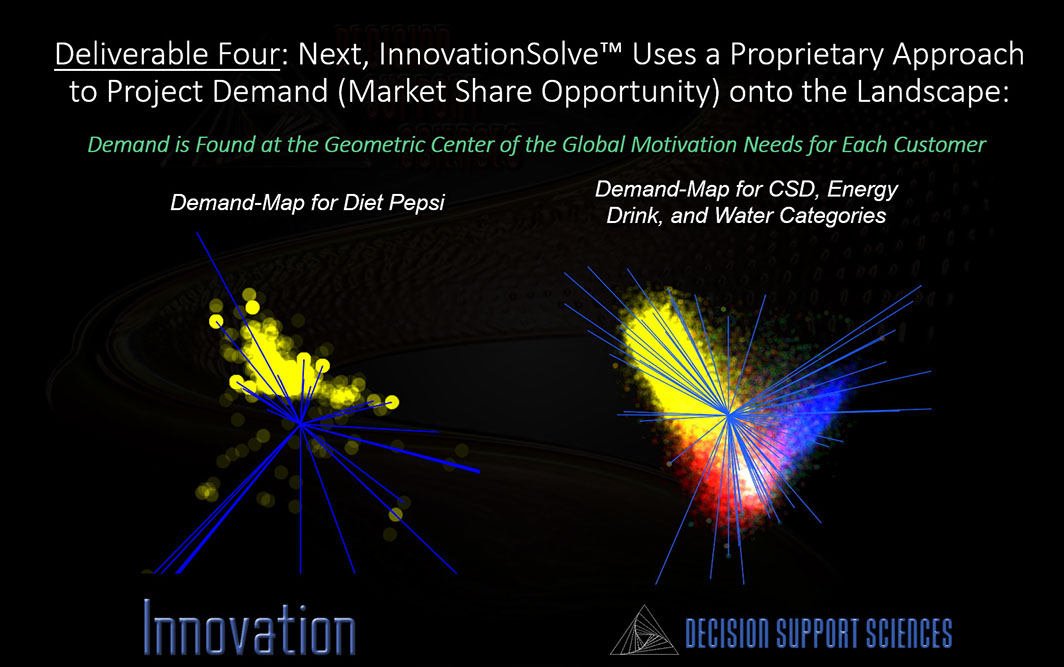
But InnovationSolve™ goes beyond PositionSolve™. It locates respondents on the brand landscape via Global Motivational Framework (GMF) theory. GMF posits that consumers purchase to satisfy felt needs. InnovationSolve™ then allows us to calculate the center (centroid) of those needs. In the projections above the fuzzy spheres are the centroids of the global motivational needs for each consumer (their "Ideal Point".) InnovationSolve™ also can project centers of need for each purchase or consumption occasion.

Just as PositionSolve™ can visualize products or brands in terms of attributes, InnovationSolve™ can visualize the center of products or brands in terms of Global Motivational Benefits on the DemandScape.™

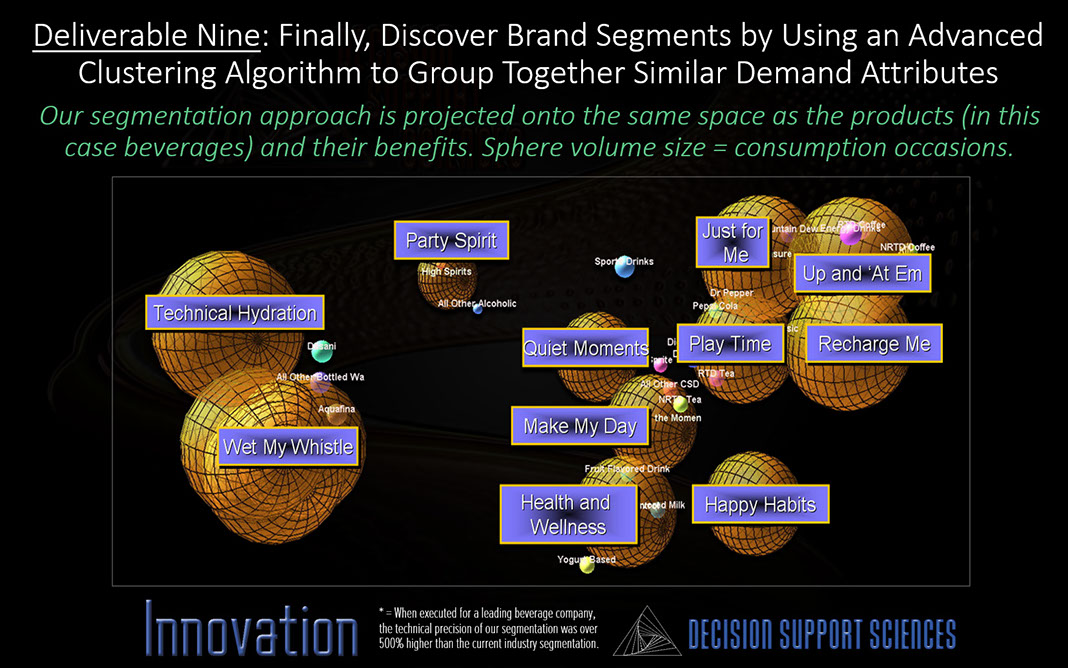
Recall that the DemandScape™ is based on Global Motivational Benefits. InnovationSolve™ can generate and plot three different types of segments on the DemandScape: ™ 1) Benefit Endpoint Clustering (BEC) which is built into InnovationSolve,™ 2) Consumer Benefit Occasion (CBO) segments or 3) Average Consumer Benefits (ACB's) segments. The last two kinds of segments are calculated using the clustering capabilities built into SegmentSolve,™ DSS's segmentation decision support software.

InnovationSolve™ allows the strategist to define a new location for an innovation two ways: 1) by moving to an area of demand OR b) defining that new location in terms of existing brands or benefits. The Innovation Simulator then builds that new innovative product and identifies which products will lose most share and where the new innovative product will “land” on the DemandScape™.

One of InnovationSolve™'s unique capabilities is that it uncovers latent demand within the brand landscape. Demand is the missing link in most strategy systems. Demand (seen here as bright semi-transparent spheres) tells us where we should build new products as well as telling us how we should message that new innovation. Being the first competitor to meet latent demand, of course, often yields dramatic improvements in market share.

InnovationSolve™ also probes into every point in the DemandScape™ to find if building a product at each of those locations will either create new demand or win share from existing competitors. The best of those newly developed products can then be handed over to the ProductSolve™ simulator to identify how much preference share and dollar volume opportunity will be produced when that product is launched.

The short course? Innovation initiatives RARELY result in break out products. Why? Because they fail to do two things:
1) They fail to discover latent (unmet) market demand.
2) They fail to build products with features and benefits that meet that demand.
Our innovation practice does both.

Our innovation practice has six steps - with each step designed to either acquire new generation, relevant data or to analyze that data in next generation, powerful ways. Doing so discovers latent demand... and delivers products to fill that demand. This is the next generation of what historically has been termed perceptual mapping...but combined with locating and visualizing demand on the brandscape (thus producing a DemandScape™.)
Visual and Dynamic Analyses
Generates Optimal Strategy Maps
Performs "What-iffing" Simulation (Repositioning and Simulation)
All the Insight of Our Positioning Practice
Locates Demand (Customer Ideal Points)
Places Products on the DemandScape™
Projects Segments on the DemandScape™
Enables Demand-Based Simulation (Simulation on the DemandScape™
Performs Innovation Analysis (Moves into Areas of Maximal Market Demand)
Identifies Maximal Demand Improvement at the Lowest Cost
Innovation. We Tackled the Real Problems.
Innovation: The Resulting Steps
<
>
EXAMPLE CLIENTS
Financial Services
We have deployed innovation studies for five of the top 20 U.S. banks, mutual fund companies and investment houses.
Retail and Other
We have deployed national innovation studies for leading retail, healthcare and consulting companies.
Financial Services
Retail and Selected Other Clients